110 Years of market data on record
10.4% Average annual return, all decades
41,593× What $1 became over the full span
8 Major downturns survived since 1926
Stock

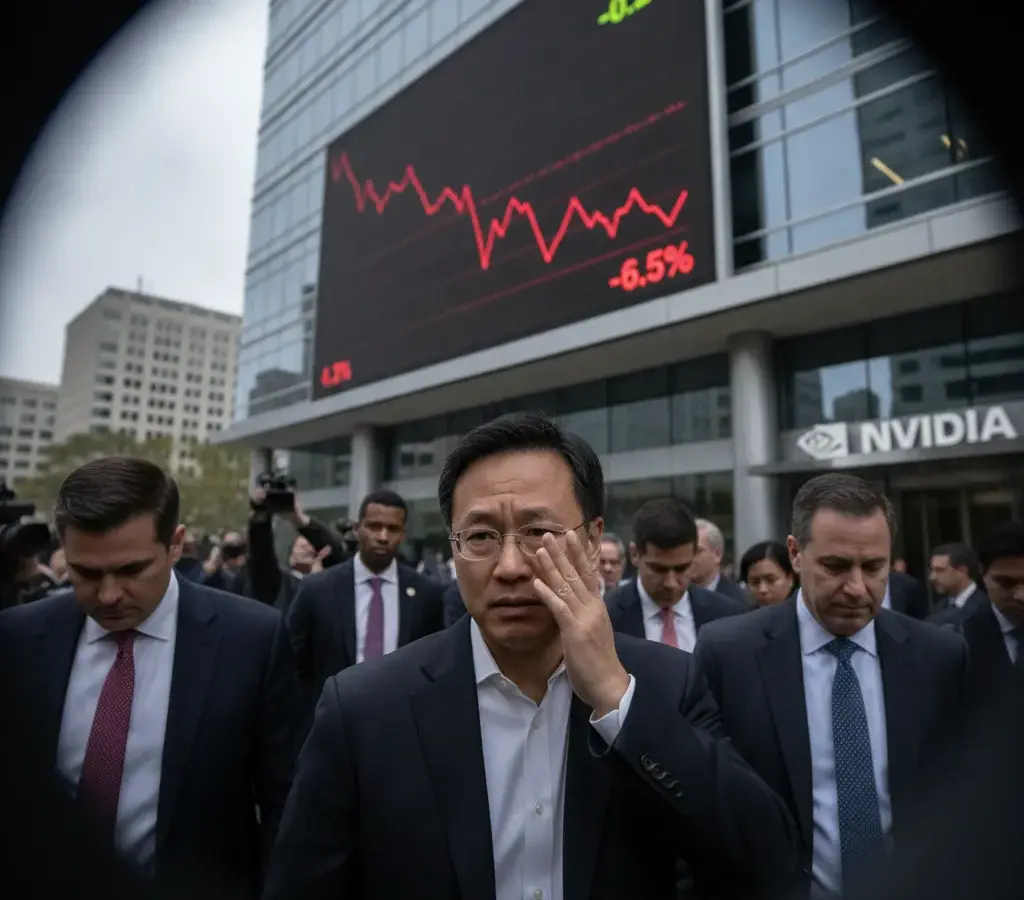
Chip Giant Shaken as Legal Storm Hits Leadership

Shares of Nvidia took a sharp dive today following revelations that the company has launched an internal investigation into its chief executive, Jensen Huang. The sudden volatility comes after reports emerged linking the leadership of the world’s most prominent AI chipmaker to serious allegations involving national security and personal misconduct. Investors reacted swiftly to the […]

Sport

High Stakes and Heavy Hitters Define Final Hours of NFL Trade Window

General managers across the league are working their phones in a frantic sprint toward Tuesday’s 4 p.m. Eastern cutoff, turning the final forty eight hours of the 2026 trade deadline into a chaotic chess match. While some franchises are aggressively hunting for the missing piece that could secure a Super Bowl run, others have reached […]

A century, one decade at a time

Average annual return of the S&P 500 in each decade since 1920. Two of the eleven lost money. The other nine paid for them.

+18.0%
1920s
Roaring Twenties bull market
-0.9%
1930s
Great Depression
+9.0%
1940s
WWII and postwar boom
+19.4%
1950s
Post-war expansion and consumer boom
+7.8%
1960s
Space Race, Vietnam War spending
+5.9%
1970s
Oil crisis and stagflation
+17.3%
1980s
Reaganomics and market deregulation
+18.1%
1990s
Dot-com and technology boom
-0.9%
2000s
Dot-com bust and financial crisis
+13.5%
2010s
Longest bull market in history
+7.0%
2020s
Pandemic shock and AI-driven rebound
Best decade 1950s +19.4% Post-war expansion and consumer boom
Worst decade 1930s -0.9% Great Depression
Explore the full century

Decade averages, price return excluding dividends. Past performance does not guarantee future results.